CDM+ is designed to be responsive and handle large amounts of information. However, you may encounter an area that is not optimized for your particular data set, or you may have a network issue that is slowing down access to your database. In these cases, you can perform diagnostic steps to assist Suran's technical support and development teams in troubleshooting and resolving the performance problem.
Follow this guide to collect helpful data to send to support@suran.com.
Requirements
The following steps require:
-
Access to the Utilities window in CDM+
-
Ability to locate details about your device, and operating system
-
optional but recommended The ability to record your screen
Determine the environment
Collect the following information:
-
The type of internet connection (cable, fiber, DSL, etc.)
-
The internet connection speed per your ISP
-
The network connection of the affected device—hard-wired (ethernet) or using Wifi
-
If all devices are experiencing this issue or just one
-
If the issue occurs with the same device on different networks
-
For a laptop/tablet/phone try reproducing the issue from home or a friend's home network
-
For a desktop or any device, try using a hotspot to reproduce the issue from a cell network
-
-
The program version
-
The operating system and version of the affected device
-
The CPU type and installed RAM or model of the affected device
-
Any other information on what might have changed if the program previously performed well and this slowdown is new
Test the network
These steps usually apply for hosted clients, but may be insightful for a self-hosted, local connection.
-
Go to speedtest.net
-
Perform a test
-
Take a screenshot of the results
-
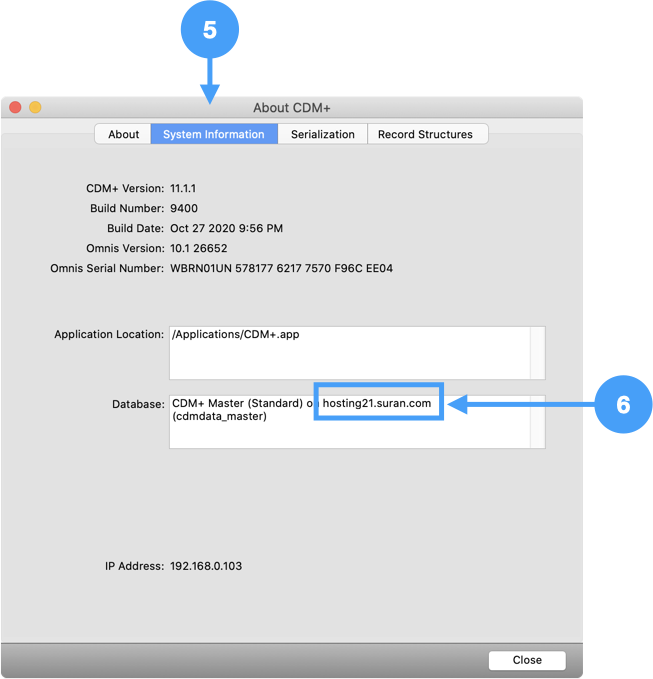
In CDM+, go to CDM+ → About CDM+ on macOS or File → About CDM+ on Windows
-
Click the System Information tab
-
Note your server host name or IP address
Ping your server
Use the command prompt to ping your server with the following command, replacing server with the server you identified in System Information. Copy the results.
macOS
ping -c 5 server
Windows
ping server
Isolate a slow operation
The program may be slow in general, or there may have a specific operation that is slow. Focus on one specific operation, even if there is a general speed issue.
An operation is defined as the behavior that occurs between clicking a button/menu item/toolbar/list line/key press/etc. and when control is returned, meaning you are able to interact with the program again.
Example operations include:
-
Opening a window
-
Refreshing a report
-
Clicking a line in a results list
-
Double-clicking the program icon to open it
-
Closing a window
Note the exact operation you are performing.
Record the operation
If you can record
If possible, and if it does not slow down the computer, record this operation using screen sharing (e.g. Zoom).
-
Open Zoom
-
Start a meeting (if you are not already in one)
-
Record your screen
-
When finished, end the meeting
-
Wait for Zoom to transcode the recording
-
If your Zoom saves recording to the cloud, copy the link to the cloud recording
-
If you have an mp4 file on your computer, upload it use the File Depot
Be sure to show any report setup or specific settings that might affect the operation in the screen recording.
If you cannot record
Take screenshots of any setup windows/tabs/options that development might need to reproduce your setup.
Profile the operation
Profiling will capture detailed information about the slow operation that development can use to troubleshoot the cause of the slowdown. Follow the steps below for your version of CDM+.
CDM+ 11.1 and later
-
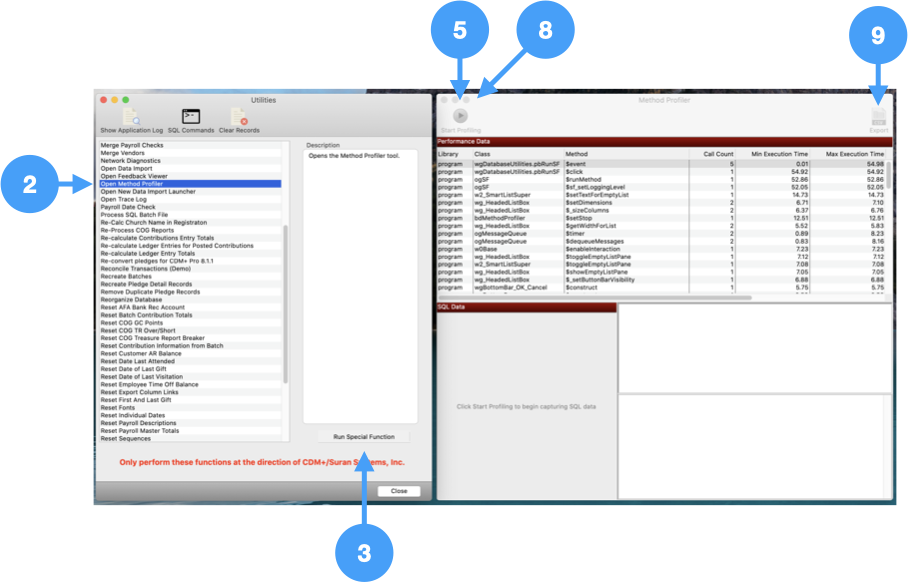
Go to File → Utilities
-
Select Open Method Profiler
-
Click Run Special Function
-
Prepare to run the slow operation (for example, configure your report but do not click Refresh)
-
Click Start Profiling on the method profiler
-
Perform the slow operation ONLY (for example, click Refresh on your report)
-
Wait for control to return
-
Click Stop Profiling on the Method Profiler
-
Click Export to produce a file that you can sent to support
-
Close the method profiler window
CDM+ 11.0 and earlier
-
Go to File → Utilities
-
Select Set Logging Level
-
Click Run Special Function
-
Chose SQL
-
Click OK
-
Select Open Method Profiler
-
Click Run Special Function
-
Prepare to run the slow operation (for example, configure your report but do not click Refresh)
-
Click Start Profiling on the method profiler
-
Perform the slow operation ONLY (for example, click Refresh on your report)
-
Wait for control to return
-
Click Stop Profiling on the Method Profiler
-
Click Export to produce a file that you can sent to supporte
-
Close the method profiler window
-
On the Utilities window click Show Application Log
-
Send a copy of the application log file to support
Report the slow down to support
Email the items you collected to support@suran.com:
-
The environment details
-
Your speed test results
-
Your server from System Information
-
Your ping results
-
A description of the slow operation
-
The method profiler results
-
The application log (for CDM+ 11.0 and earlier)
-
The screen recording or screenshots of your setup
-
Your expectation for how quickly the program should behave
Support will engage the development team to troubleshoot the root cause of the slowdown and work toward a resolution.